I found a great way to visualize my hostels reviews over time so I can quickly spot trends in our customer service performance. It's called TableTools2 and it works with Firefox. The tool will create charts from data on any table on any website.
As hostel owners, we of course all know that reputation is vitally important to the success of our businesses. In this internet era, like it or not, the reputation of our hostel is largely affected the customer comments, and reviews found on various online review sites. Because of this, the success of our business depends on being attentive to online reviews and making in-hostel adjustments as quickly as possible.
The Problem with Hostel Reviews Data
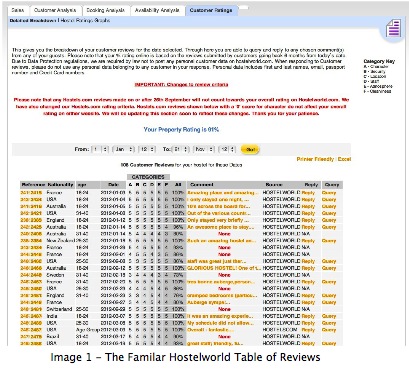
Sites like Hostelworld and Hostelbookers provide us with detailed information from guest surveys that includes age range, and nationality. Unfortunately, this data is only provided in the form of long tables as shown in image 1 below. All of this data resembles our public reputation which affects our profitability but analyzing the data can be difficult and time consuming.
Unfortunately, most hostels tend to focus solely on the overall percentage rating. But, by the time we notice a decline in our overall property percentage, the damage has already been done and it's sometimes difficult to get the hostel back on track because hostel staff are now operating under what I call “The New Normal” of customer service, cleaning, etc.
I have recently starting using a new Firefox add-on called TableTools2. This tool is invaluable for spotting trends (positive or negative) as they first start happening. This enables me to intervene and make adjustments more quickly. Using this add-on we can quickly sort, filter, and chart the massive amounts of data available to us. This allows us to better evaluate how we are are doing and shows where improvements are needed. In addition, by combining several features of the tool we can restrict our analysis of reviews to a specific demographics so we can see if hostel improvements can be made to cater to specific age groups or nationalities. I shared this tool with Josh and he was so impressed he asked that I write a tutorial on how to use it. So here it is.
The following detailed tutorial will help show you how to begin using TableTools2 to compile useful information and charts from your hostel data.
Downloading TableTools2 for Firefox
First you'll need to download and install the add-on for your Mozilla Firefox browser. Click on the following URL or copy and paste the address to your browser's search box: http://www.mingyi.org/TableTools2 .
Once there, click on "Install/Contribute/Contribute" on the right side of the top menu bar. Then, under Install TableTools2 for Firefox, download the latest version of the software. This will open another page with many version of the add-on, click the "add to Firefox" button next to the most recent version to download and begin installation. Notice the developer (Mingyi Liu) wrote contribute twice. If you like TableTools2, I encourage you to donate so this developer will see value in improving this useful charting tool for business.
After installation, you'll be able to use the tool to examine any HTML table on any web page, but for this tutorial, we're going to use the long table of data provided to us by HostelWorld.
Charting Your Hostels Overall Performance
As stated above, sometimes it's difficult to spot damaging trends in customer satisfaction before it's too late. This is why using TableTools2 on a regular basis will be helpful. Here is a perfect example of how it can help monitor hostel performance.
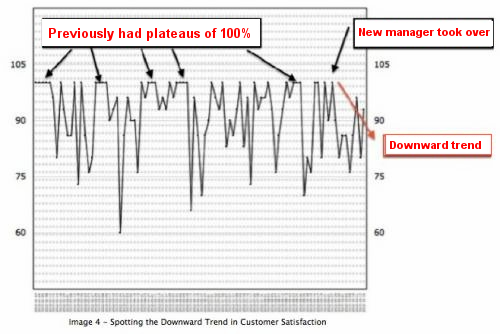
Let's say there was a manager change at the hostel and after 15 days, as far as the overall property rating and personal customer comments were concerned, it looked as if everything was fine. However, creating a line graph that showed performance ratings by date may reveal a different story.
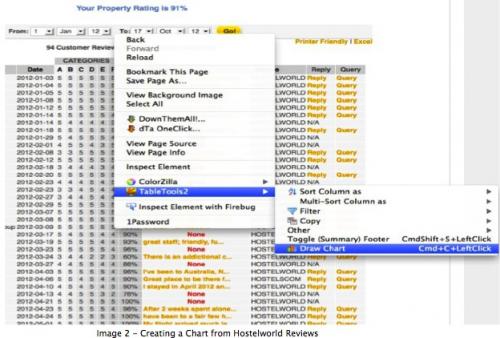
To create this chart, control click (right click on Windows) on the HostelWorld table, then under TableTools2, select "draw chart." See image 2.
In the chart menu that comes up, choose "line chart" under chart type, "date" under chart category label, and "all" under Y. Then click the "Draw Chart" button.

As you can see by the chart shown below (which is from my hostel Pacific Tradewinds), a slight downward trend in our rating began about the same time our new manager took over. This chart allowed us to visualize the data in a new way, which provided valuable information to both me and the manager so adjustments could be made.
Examining Specific Categories by Date
It is also possible to create graphs by date for each of the various categories Hostelworld has. This is done by choosing "date" under chart category label and the letter that corresponds with the category of interest (ie: A = Character, B = Security, C = Location, D = Staff, E = Atmosphere, and F = Cleanliness) under Y. In looking at our category scores during these dates, we saw a lowering trend in scores in Hostelworld’s character category.
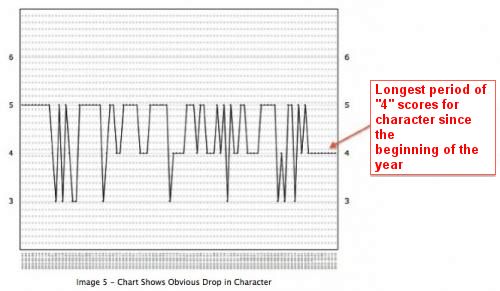
Instead of just looking at a jumble of numbers on a table, TableTools2 helped us to examine the details. In that examination, we saw that guests were now scoring us a 4 for character, which was having a large affect on our overall rating. This was a great indicator that our guests were no longer getting what I call "warm fuzzies" when they thought of our hostel. Time to take action!
Assessing Customer Reviews by Nationality or Age
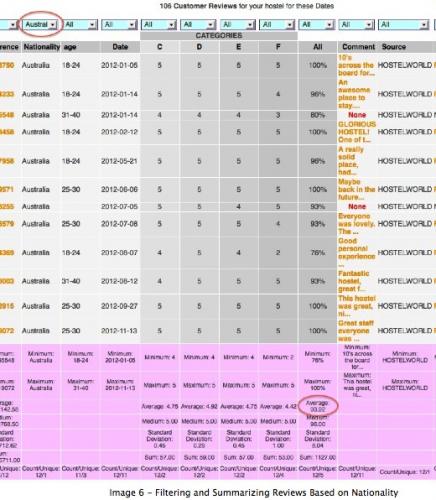
Charts aren't the only feature that is useful in TableTools2. Data can be filtered before charting. This can be very useful in narrowing down our ratings based on age or nationality. This takes a bit more work than simple charting but it's useful nonetheless.
From the HostelWorld chart, control click (right click Windows), then select TableTools2, just as you have before. However, this time you need to select the "filter" option from the menu. Under the "filter" menu select "toggle dropdown filters" This gives each column of the chart dropdown menus that allow you to filter data by specific criteria. Then control click again and select "Toggle Summary Footer". This will produce a footer that contains valuable data like Minimum, Maximum, Average, Medium, Standard Deviation, Etc. Then you only need to select each nationality you are interested in. The average rating will be recalculated for each nationality you choose.
I encourage hostel owners to download this tool and make visual charts of your data. Can you think of new ways to use this tool for the visualization of hostel data? If so, please post them in the forum.
Bonus - Video Tutorials for TableTools2
Video tutorial for hostels using TableTools2
Another video tutorial for hostels using TableTools2

